No products in the cart.


Description
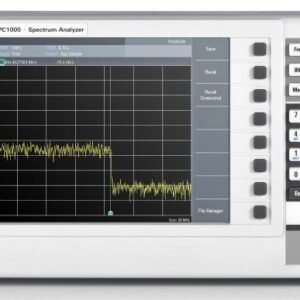
Tektronix RSA513A – Real-Time Spectrum Analyzers (9 kHz to 13.6 GHz Frequency Range)

- Frequency Range: 9 kHz-13.6 GHz
- Real-Time Bandwidth: 40 MHz
- Minimum Event Duration for 100% POI: 15 μs
- SFDR (typical): 70 dBc
- Weight: 3.85 kg (8.5 lb) with battery
The RSA513A was built to bring real-time spectrum analysis to solving the problems of spectrum managers, interference hunters, and network maintenance personnel who need to track down hard-to-find interferers, maintain RF networks and keep records of their efforts. The heart of the system is the USB-based RF spectrum analyzer that captures 40 MHz real-time bandwidths with great fidelity in harsh environments. With a 70 dB spurious-free dynamic range and frequency coverage to 13.6 GHz, all signals of interest can be examined with high confidence in your measurement results. The USB form factor moves the weight of the instrument off of your hands and replaces it with a lightweight Windows tablet or laptop. Holding a light PC instead of a heavy spectrum analyzer means you can move faster, for longer, and get your work done faster.
The optional tracking generator enables gain/loss measurements for quick tests of filters, duplexers, and other network elements, and you can add cable and antenna measurements of VSWR, return loss, distance to fault, and cable loss as needed.
SignalVu-PC software offers rich analysis capability in the field
The RSA513A operates with SignalVu-PC, a powerful program used as the basis of Tek’s traditional spectrum analyzers. SignalVu-PC offers a deep analysis capability previously unavailable in high-performance battery-operated solutions. Real-time processing of the DPX® spectrum/spectrogram is enabled in your PC, further reducing the cost of hardware. Customers who need programmatic access to the instrument can choose either the SignalVu-PC programmatic interface or use the included application programming interface (API) that provides a rich set of commands and measurements directly. The basic functionality of the free SignalVu-PC program is far from basic. Base version measurements are shown below.
The RSA513A combined with SignalVu-PC offers advanced field measurements
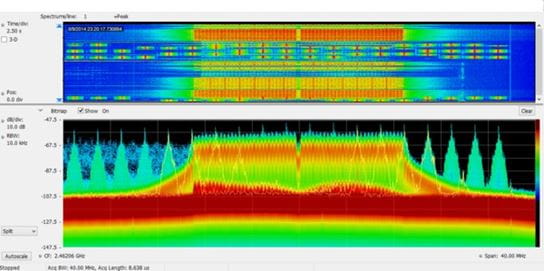
With 40 MHz of real-time bandwidth, the unique DPX® spectrum/spectrogram shows you every instance of an interfering or unknown signal, even down to 15 μs in duration. The following image shows a WLAN transmission (green and orange), and the narrow signals that repeat across the screen are a Bluetooth access probe. The spectrogram (upper part of the screen) clearly separates these signals in time to show any signal collisions.
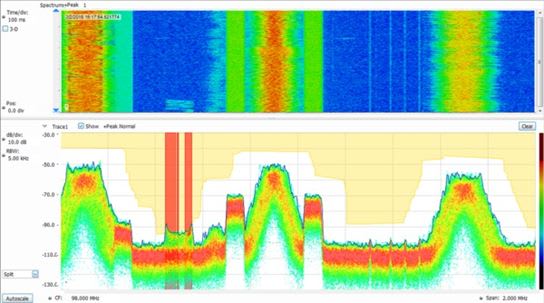
Finding unexpected signals is easy with unattended mask monitoring. A mask can be created on the DPX® spectrum display, and actions taken upon every violation, including stop, save a picture, save acquisition, or send an audible alert. In the illustration below, a mask violation has occurred in red on the mask, and a picture of the screen was saved as a result. Mask testing can be used for unattended monitoring and when playing back recorded signals, enabling testing for different violations on the same signals.
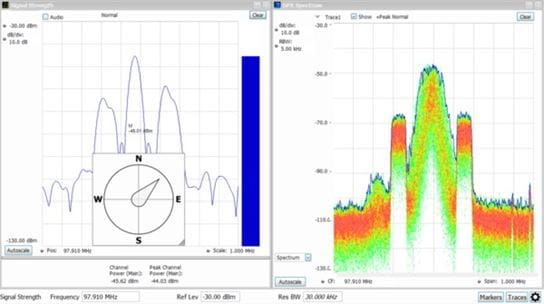
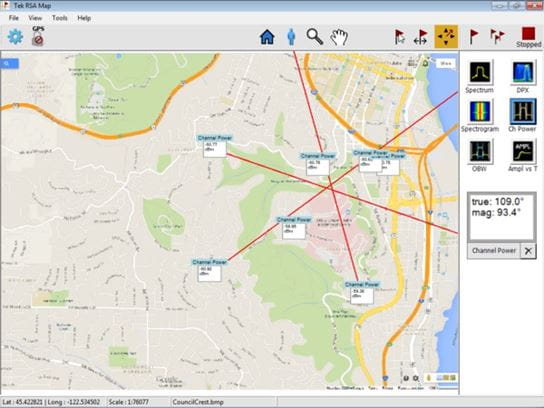
Direction-finding and signal strength measurements are quick and easy with the standard SignalVu-PC software. In the illustration below, using the recommended 3rd party Alaris smart antenna, a compass continuously monitors antenna direction while the signal strength monitor performs measurements and provides an audio indication of signal strength. When combined with the MAP option for SignalVu-PC, signal strength and azimuth are automatically placed on the map of your choice.
SignalVu-PC application-specific licenses
SignalVu-PC offers a wealth of application-oriented options available either installed on the instrument, or as a floating license that can be moved between instruments or attached to your PC. Applications include:
- General-purpose modulation analysis (27 modulation types including 16/32/64/256 QAM, QPSK, O-QPSK, GMSK, FSK, APSK)
- EMC/EMI analysis with CISPR peak, quasi-peak, and average detectors
- Bluetooth® analysis of Basic Rate, Low Energy, and Bluetooth 5. Some support of Enhanced Data Rate
- P25 analysis of phase I and phase 2 signals
- WLAN analysis of 802.11a/b/g/j/p, 802.11n, 802.11ac
- LTE™ FDD and TDD Base Station (eNB) Cell ID and RF measurements
- Mapping
- Pulse analysis
- AM/FM/PM/Direct Audio Measurement including SINAD, THD
- Playback of recorded files, including complete analysis in all domains
- Signal classification and survey
EMC/EMI
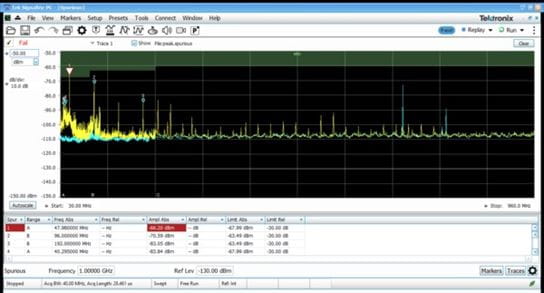
EMI pre-compliance and diagnostic measurements are easy with the instrument and SignalVu-PC. Transducer, antenna, preamplifier, and cable gain/loss can be entered and stored in correction files, and the standard spurious measurement feature of SignalVu-PC can be used to establish limit lines for your test. The following illustration shows a test from 30MHz to 960 MHz against the FCC Part 15 Class A limit shown shaded. The blue trace is the capture of Ambient. Violations are recorded in the results table below the graph. CISPR quasi-peak and average detectors can be added with option SVQP.
The EMC pre-compliance solution can be added with option EMCVU. It supports many predefined limit lines. It also adds a wizard for easy setup of recommended antennas, LISN, and other EMC accessories with a one-button push. When using the new EMC-EMI display, you can accelerate the test by applying the time-consuming quasi-peak only on failures. This display also provides a push-button ambient measurement. The Inspect tool lets you measure frequencies of interest locally, removing the need for scanning.
Bluetooth
Two new options have been added to help with Bluetooth SIG standard base transmitter RF measurements in the time, frequency, and modulation domains. Option SV27 supports Basic Rate and Low Energy Transmitter measurements defined by RF.TS.4.2.0 and RF-PHY.TS.4.2.0 Test Specification. It also demodulates and provides symbol information for Enhanced Data Rate packets. Option SV31 supports Bluetooth 5 standards (LE 1M, LE 2M, LE Coded) and measurements defined in the Core Specification. Both options also decode the physical layer data that is transmitted and color-encode the fields of the packet in the Symbol Table for clear identification.
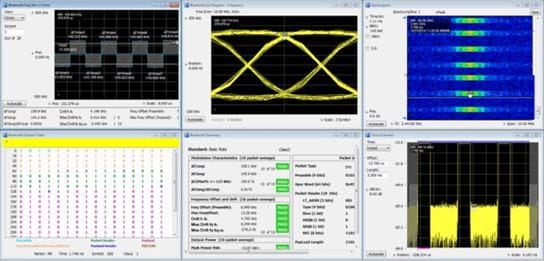
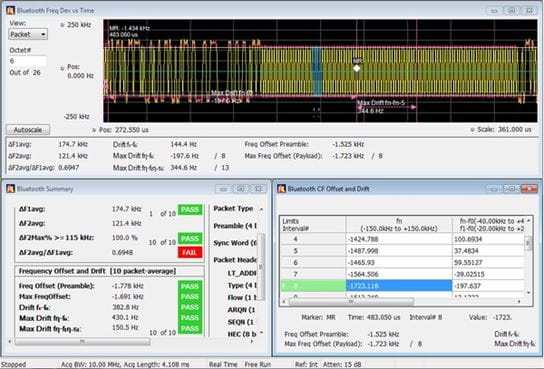
Pass/Fail results are provided with customizable limits. Measurement below shows deviation vs. time, frequency offset, and drift and a measurement summary with Pass/Fail results.
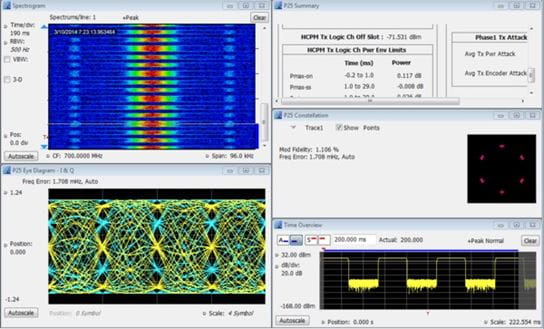
APCO 25
SignalVu-PC application SV26 enables quick, standards-based transmitter health checks on APCO P25 signals. The following image shows a Phase II HCPM signal being monitored for anomalies with the spectrogram while performing transmitter power, modulation, and frequency measurements to the TIA-102 standards specification.
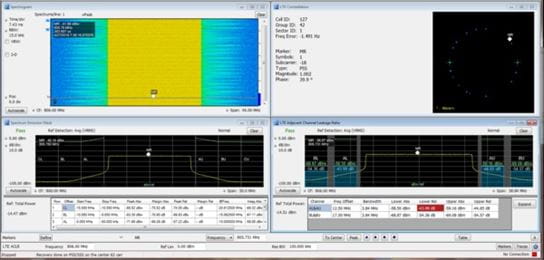
LTE
Application SV28 enables the following LTE base station transmitter measurements:
- Cell ID
- Channel power
- Occupied bandwidth
- Adjacent channel leakage ratio (ACLR)
- Spectrum emission mask (SEM)
- Transmitter off power for TDD
- Reference Signal (RS) Power
The measurements follow the definition in 3GPP TS Version 12.5 and support all base station categories, including picocells and femtocells. Pass/Fail information is reported and all channel bandwidths are supported.
The Cell ID preset displays the Primary Synchronization Signal (PSS) and the Secondary Synchronization Signal (SSS) in a Constellation diagram. It also provides Frequency Error.
The illustration below shows spectral monitoring with the spectrogram display combined with a Cell ID/Constellation, Spectrum Emission Mask and ACLR measurements.
Mapping
The SignalVu-PC MAP application enables interference hunting and location analysis. Locate interference with an azimuth function that lets you draw a line or an arrow on a mapped measurement to indicate a direction, or use the recommended Alaris smart antenna with automated azimuth placement.
Signal survey/classification
Application SV54 enables expert systems guidance to aid the user in classifying signals. You can quickly create a spectral region of interest, enabling users to identify and sort signals efficiently. The spectral profile mask, when overlaid on top of a trace, provides signal shape guidance while frequency, bandwidth, and channel number are displayed allowing for fast classification. WLAN, GSM, W-CDMA, CDMA, Bluetooth standard and enhanced data rate, LTE FDD and TDD, ATSC, and other signals can be quickly and simply identified. Databases can be imported from your H500/RSA2500 signal database library for an easy transition to the new software base.
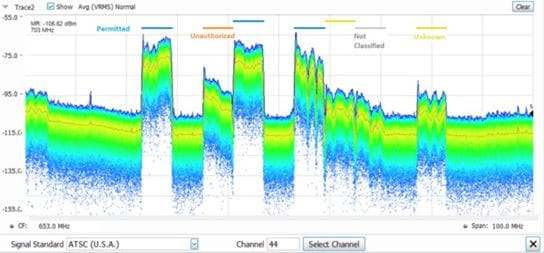
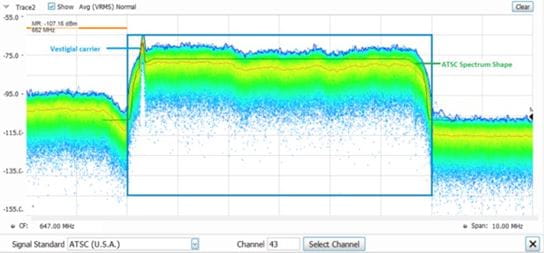
A typical signal survey is shown below. The survey is of a portion of the TV broadcast band, and 7 regions have been declared as either Permitted, Unknown, or Unauthorized, as indicated by the color bars for each region. In the detailed illustration, a single region has been selected, and since we’ve declared this to be an ATSC video signal, the spectrum mask for the ATSC signal is shown overlaid in the region. The signal is a close match to the spectrum mask, including the vestigial carrier at the lower side of the signal, characteristic of ATSC broadcasts.
Spectrum Analyzers/Spectrum Analyzers Template | |
|---|---|
| Tracking Generator | Yes |
| Channel Power Measurement | Yes |
| Marker Measurement | Yes |
| AM/FM Demodulation | Yes |
Product General Attributes | |
| Country of Origin | United States |
You must be logged in to post a review.
Manuals/Guides
ManualsSpec SheetsApplication Notes
Related products

Sale

Rigol DSA875-TG Spectrum Analyzers – Bandwidth Range Max: 7.5 Ghz, Bandwith Range Min: 9 kHz, Noise Floor: 161 dB
Original price was: $7,698.90.$6,621.06Current price is: $6,621.06. Add to cart
 Tektronix RSA513A – Real...
 $30,800.00
Our team of knowledgeable professionals is here to help you make informed decisions. Whether you need product recommendations, technical support, or guidance on your purchase, we're just a click away.
Contact Us Now:
📧 sales@nestesinstruments.com
📞 +1 (833) 763-7837
Let us assist you in finding the perfect solution!
Contact Us Now:
📧 sales@nestesinstruments.com
📞 +1 (833) 763-7837
Let us assist you in finding the perfect solution!
Reviews
There are no reviews yet.